
Thank you to Ken Crawford of Devon Senior Voice for sharing this thought provoking article.
The Office of National Statistics (ONS) has been collating Fuel Poverty Statistic since 1996, the figures are released each June about 18 months in arrears; so, the 2018 release relates to 2016.
Fuel poverty is a national issue and part of the remit of the Health and Wellbeing Boards, but whether these understand the problem is debatable, as to understand Fuel Poverty you have to have lived in it, (National Children’s Bureau).
The fuel poverty charity National Energy Action’s research shows that cold homes claim needless lives and cost every local health trust in England more than £27,000 each day, that’s £30m per year in Devon on treating patients with health conditions caused or worsened by living in cold, damp housing. Nationally, cold homes cost the NHS £3.6m per day, and in the past four years alone over £5bn of tax payers’ money has been wasted while 117,000 people have died needlessly due to the cold.
But what is Fuel Poverty? Practically it’s not having enough money to heat your home or cook your food. The ONS has a more complex definition using the Low-Income High Costs (LIHC) indicator, a household is considered to be fuel poor if:
• they have required fuel costs that are above average (the national median level).
• were they to spend that amount, they would be left with a residual income below the official poverty line.
This replaced the 10% indicator which simply said if you spend more than 10% of your disposable income, (after taxes and housing costs), you are fuel poor. Why the change? Simply because under the 10% indicator was putting too many homes in the fuel poverty range; in Devon in 2011 under the LIHC indicator fuel poverty was 12.58%. 1 in 8; whilst under the 10% indicator it was 17.51%, 1 in 6 with Torridge and West Devon running at 1 in 4.
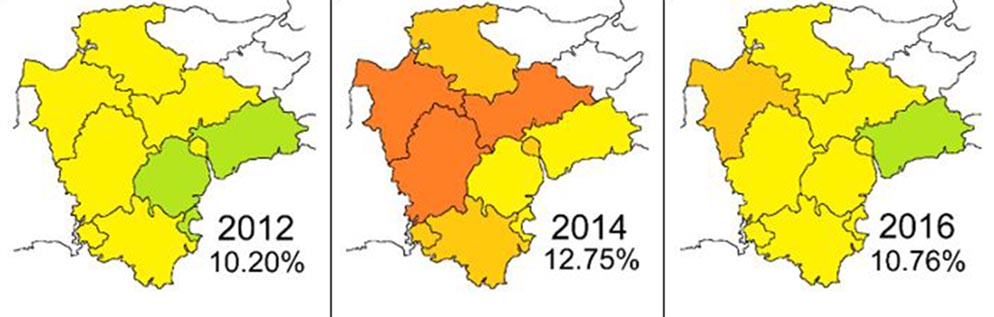
So how has Devon fared this decade? By 2012 Devon’s fuel poverty was down to 10.20%, below the National average; by 2014 it had risen to 12.75%; the 2016 statistics released this year show a decrease to 10.76%, so in four years we are not quite back to square one.
What causes this? Undoubtedly the increase in 2014 was caused by escalating fuel prices and now the effect of the 19,500 eco measures, insulation, double glazing and replacement boilers have kicked in, although their effect has been decreased by further fuel price increases. We should see further decreases in the future, but the effect of the eco measures is countered by escalating fuel prices.
Unless we tackle the “Elephant in the Room” and reduce fuel prices, Fuel Poverty will be a problem way into the future.
Please get in touch with dsv@devoncommunities.org.uk if you would like to find out more about our current and past projects related to fuel poverty or if you would like any more information about this article.